
 Yahoo Movies
 Covid-19 case rates for areas that could move into Tier 3
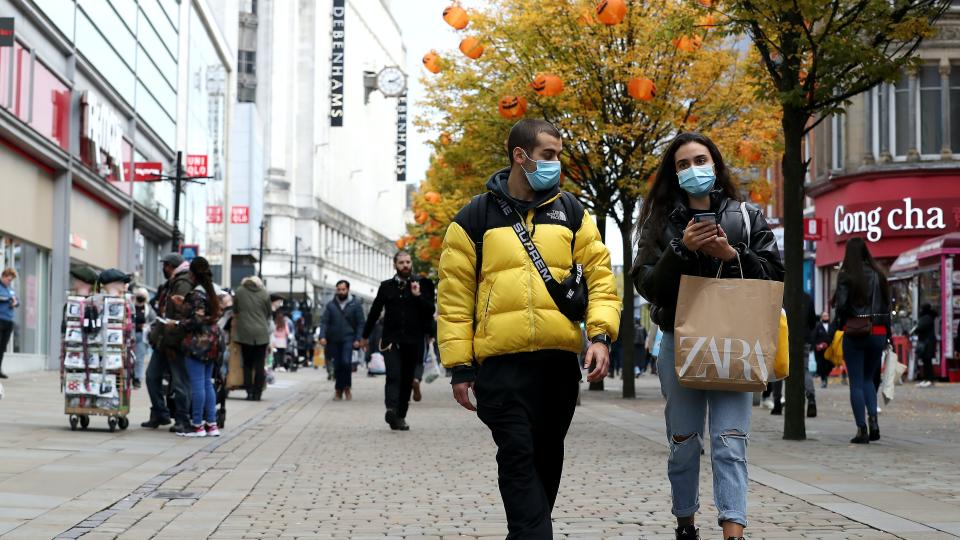


Here are the latest weekly Covid-19 rates for areas of England that could be moving shortly from Tier 2 to Tier 3 of the Government’s Covid restrictions.
The latest rate is for the seven days to October 15, and the comparison (in brackets) is for the seven days to October 8.
All figures have been calculated by the PA news agency using Public Health England data.
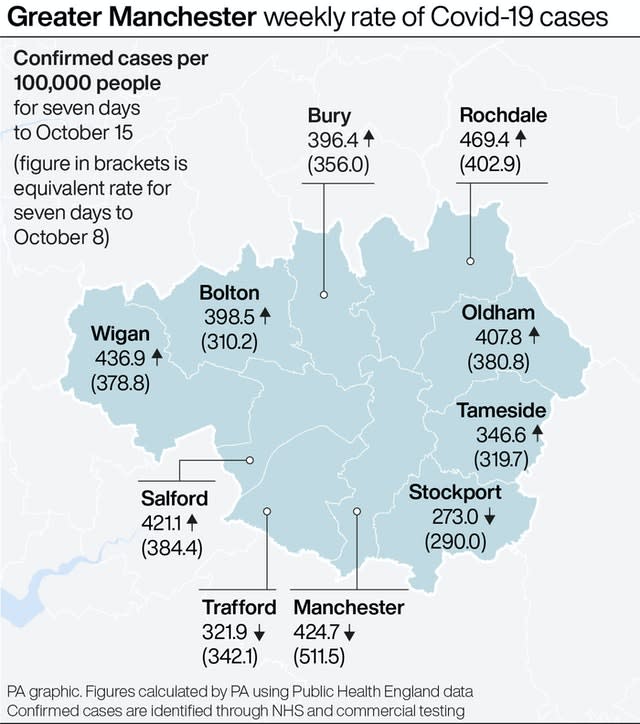
– Greater Manchester
The latest rate for the whole of Greater Manchester, which has a population of 2.8 million, is 392.8 cases per 100,000 people – up slightly on 381.8 in the previous week.
The rate is falling in three of the 10 local authority areas: Manchester, Stockport and Trafford.
Bolton 398.5 (310.2)
Bury 396.4 (356.0)
Manchester 424.7 (511.5)
Oldham 407.8 (380.8)
Rochdale 469.4 (402.9)
Salford 421.1 (384.4)
Stockport 273.0 (290.0)
Tameside 346.6 (319.7)
Trafford 321.9 (342.1)
Wigan 436.9 (378.8)
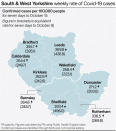
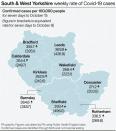
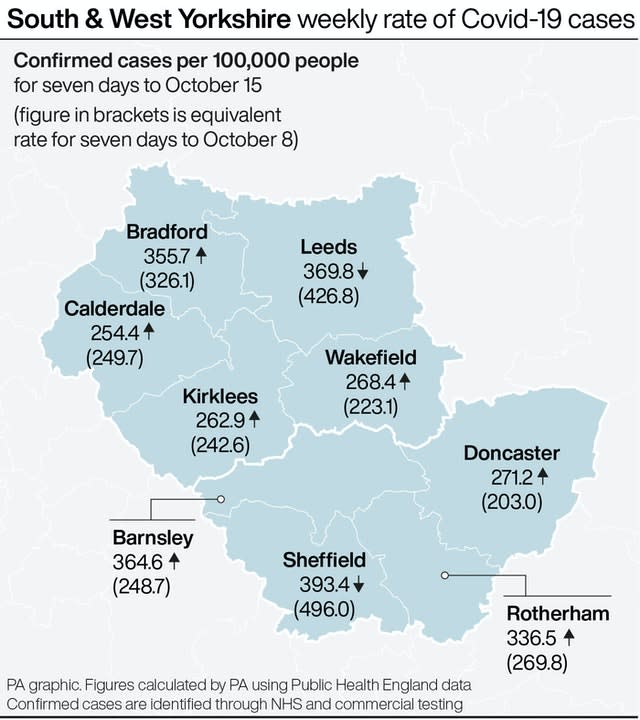
– South Yorkshire
The rate across the whole of South Yorkshire (population 1.4 million) is currently 350.6, up very slightly on 345.2.
Sheffield’s rate has dropped sharply, while the rate in the other three areas has increased.
Barnsley 364.6 (248.7)
Doncaster 271.2 (203.0)
Rotherham 336.5 (269.8)
Sheffield 393.4 (496.0)
Watch: How will England’s three-tier lockdown system work?
– West Yorkshire
In West Yorkshire (population 2.3 million) the rate is currently 320.8, down very slightly from 322.3.
The rate in Leeds has fallen week on week, while the other areas have recorded a rise.
Bradford 355.7 (326.1)
Calderdale 254.4 (249.7)
Kirklees 262.9 (242.6)
Leeds 369.8 (426.8)
Wakefield 268.4 (223.1)
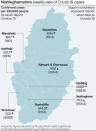
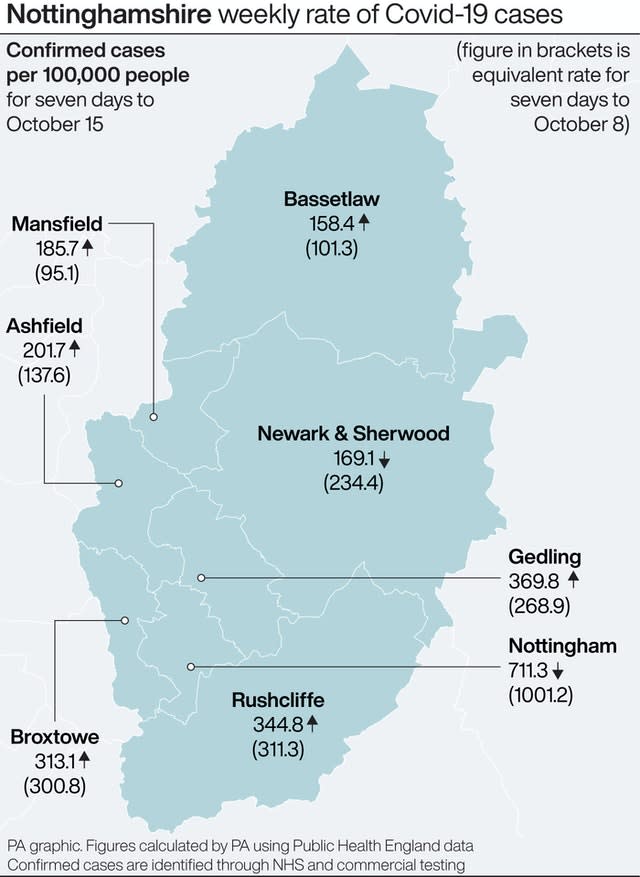
– Nottinghamshire
The overall rate has decreased in Nottinghamshire (population 1.2 million) from 434.9 to 381.2, driven largely by the sharp fall in the rate for Nottingham.
Ashfield 201.7 (137.6)
Bassetlaw 158.4 (101.3)
Broxtowe 313.1 (300.8)
Gedling 369.8 (268.9)
Mansfield 185.7 (95.1)
Newark and Sherwood 169.1 (234.4)
Nottingham 711.3 (1001.2)
Rushcliffe 344.8 (311.3)
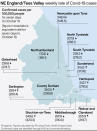
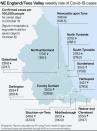
– North-east England
Across the seven areas of north-east England that might be moving into Tier 3 (population 2.0 million), the overall rate has fallen from 316.6 to 280.6.
The local rates are also dropping in most areas.
County Durham 350.5 (299.8)
Gateshead 236.6 (274.7)
Newcastle upon Tyne 348.4 (545.5)
North Tyneside 207.8 (288.1)
Northumberland 170.6 (195.1)
South Tyneside 229.2 (276.2)
Sunderland 315.8 (313.6)
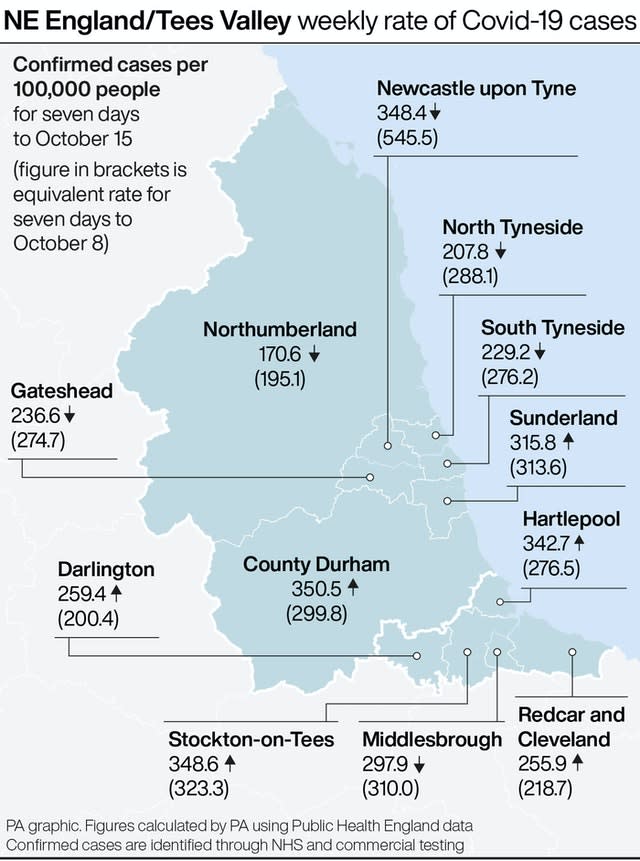
– Tees Valley
The rate for the Tees Valley area (population 676,000) has risen from 273.4 to 304.3.
All the local areas apart from Middlesbrough have recorded an increase.
Darlington 259.4 (200.4)
Hartlepool 342.7 (276.5)
Middlesbrough 297.9 (310.0)
Stockton-on-Tees 348.6 (323.3)
Redcar and Cleveland 255.9 (218.7)
Watch: Can you catch Covid twice?
