
 Yahoo Movies
 Abbott Laboratories (NYSE:ABT) institutional owners may be pleased with recent gains after 22% loss over the past year
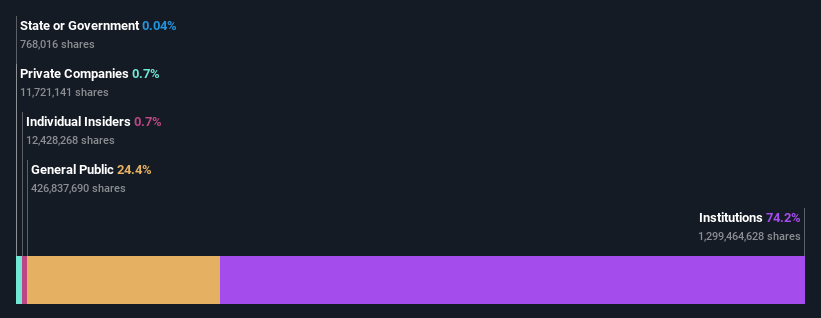
A look at the shareholders of Abbott Laboratories (NYSE:ABT) can tell us which group is most powerful. We can see that institutions own the lion's share in the company with 74% ownership. That is, the group stands to benefit the most if the stock rises (or lose the most if there is a downturn).
Last week's US$7.8b market cap gain would probably be appreciated by institutional investors, especially after a year of 22% losses.
Let's delve deeper into each type of owner of Abbott Laboratories, beginning with the chart below.
View our latest analysis for Abbott Laboratories
What Does The Institutional Ownership Tell Us About Abbott Laboratories?
Institutional investors commonly compare their own returns to the returns of a commonly followed index. So they generally do consider buying larger companies that are included in the relevant benchmark index.
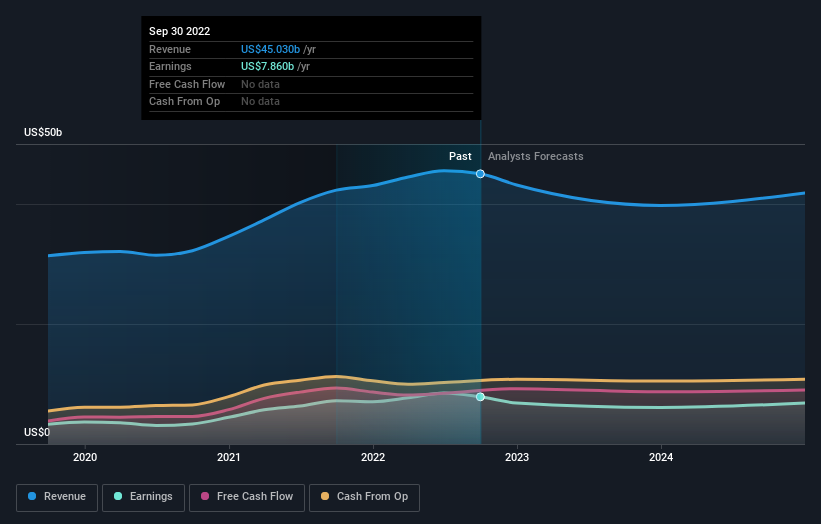
As you can see, institutional investors have a fair amount of stake in Abbott Laboratories. This implies the analysts working for those institutions have looked at the stock and they like it. But just like anyone else, they could be wrong. It is not uncommon to see a big share price drop if two large institutional investors try to sell out of a stock at the same time. So it is worth checking the past earnings trajectory of Abbott Laboratories, (below). Of course, keep in mind that there are other factors to consider, too.
Investors should note that institutions actually own more than half the company, so they can collectively wield significant power. We note that hedge funds don't have a meaningful investment in Abbott Laboratories. The Vanguard Group, Inc. is currently the company's largest shareholder with 8.7% of shares outstanding. The second and third largest shareholders are Capital Research and Management Company and BlackRock, Inc., with an equal amount of shares to their name at 7.7%.
A deeper look at our ownership data shows that the top 25 shareholders collectively hold less than half of the register, suggesting a large group of small holders where no single shareholder has a majority.
Researching institutional ownership is a good way to gauge and filter a stock's expected performance. The same can be achieved by studying analyst sentiments. There are plenty of analysts covering the stock, so it might be worth seeing what they are forecasting, too.
Insider Ownership Of Abbott Laboratories
The definition of an insider can differ slightly between different countries, but members of the board of directors always count. The company management answer to the board and the latter should represent the interests of shareholders. Notably, sometimes top-level managers are on the board themselves.
I generally consider insider ownership to be a good thing. However, on some occasions it makes it more difficult for other shareholders to hold the board accountable for decisions.
Our information suggests that Abbott Laboratories insiders own under 1% of the company. Being so large, we would not expect insiders to own a large proportion of the stock. Collectively, they own US$1.2b of stock. In this sort of situation, it can be more interesting to see if those insiders have been buying or selling.
General Public Ownership
With a 24% ownership, the general public, mostly comprising of individual investors, have some degree of sway over Abbott Laboratories. While this group can't necessarily call the shots, it can certainly have a real influence on how the company is run.
Next Steps:
I find it very interesting to look at who exactly owns a company. But to truly gain insight, we need to consider other information, too. Consider risks, for instance. Every company has them, and we've spotted 1 warning sign for Abbott Laboratories you should know about.
If you would prefer discover what analysts are predicting in terms of future growth, do not miss this free report on analyst forecasts.
NB: Figures in this article are calculated using data from the last twelve months, which refer to the 12-month period ending on the last date of the month the financial statement is dated. This may not be consistent with full year annual report figures.
Have feedback on this article? Concerned about the content? Get in touch with us directly. Alternatively, email editorial-team (at) simplywallst.com.
This article by Simply Wall St is general in nature. We provide commentary based on historical data and analyst forecasts only using an unbiased methodology and our articles are not intended to be financial advice. It does not constitute a recommendation to buy or sell any stock, and does not take account of your objectives, or your financial situation. We aim to bring you long-term focused analysis driven by fundamental data. Note that our analysis may not factor in the latest price-sensitive company announcements or qualitative material. Simply Wall St has no position in any stocks mentioned.
Join A Paid User Research Session
You’ll receive a US$30 Amazon Gift card for 1 hour of your time while helping us build better investing tools for the individual investors like yourself. Sign up here

