
 Yahoo Movies
 Capital Allocation Trends At Barnes Group (NYSE:B) Aren't Ideal
When we're researching a company, it's sometimes hard to find the warning signs, but there are some financial metrics that can help spot trouble early. When we see a declining return on capital employed (ROCE) in conjunction with a declining base of capital employed, that's often how a mature business shows signs of aging. This indicates the company is producing less profit from its investments and its total assets are decreasing. So after we looked into Barnes Group (NYSE:B), the trends above didn't look too great.
What Is Return On Capital Employed (ROCE)?
For those that aren't sure what ROCE is, it measures the amount of pre-tax profits a company can generate from the capital employed in its business. To calculate this metric for Barnes Group, this is the formula:
Return on Capital Employed = Earnings Before Interest and Tax (EBIT) ÷ (Total Assets - Current Liabilities)
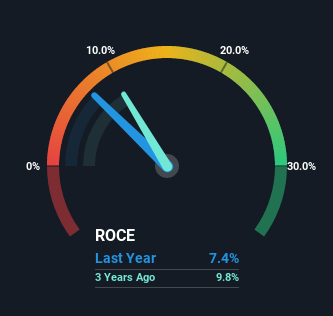
0.074 = US$149m ÷ (US$2.3b - US$284m) (Based on the trailing twelve months to September 2022).
So, Barnes Group has an ROCE of 7.4%. Ultimately, that's a low return and it under-performs the Machinery industry average of 11%.
See our latest analysis for Barnes Group
In the above chart we have measured Barnes Group's prior ROCE against its prior performance, but the future is arguably more important. If you'd like, you can check out the forecasts from the analysts covering Barnes Group here for free.
What Can We Tell From Barnes Group's ROCE Trend?
In terms of Barnes Group's historical ROCE movements, the trend doesn't inspire confidence. Unfortunately the returns on capital have diminished from the 11% that they were earning five years ago. And on the capital employed front, the business is utilizing roughly the same amount of capital as it was back then. Companies that exhibit these attributes tend to not be shrinking, but they can be mature and facing pressure on their margins from competition. If these trends continue, we wouldn't expect Barnes Group to turn into a multi-bagger.
The Bottom Line
In summary, it's unfortunate that Barnes Group is generating lower returns from the same amount of capital. Long term shareholders who've owned the stock over the last five years have experienced a 34% depreciation in their investment, so it appears the market might not like these trends either. With underlying trends that aren't great in these areas, we'd consider looking elsewhere.
Like most companies, Barnes Group does come with some risks, and we've found 3 warning signs that you should be aware of.
While Barnes Group isn't earning the highest return, check out this free list of companies that are earning high returns on equity with solid balance sheets.
Have feedback on this article? Concerned about the content? Get in touch with us directly. Alternatively, email editorial-team (at) simplywallst.com.
This article by Simply Wall St is general in nature. We provide commentary based on historical data and analyst forecasts only using an unbiased methodology and our articles are not intended to be financial advice. It does not constitute a recommendation to buy or sell any stock, and does not take account of your objectives, or your financial situation. We aim to bring you long-term focused analysis driven by fundamental data. Note that our analysis may not factor in the latest price-sensitive company announcements or qualitative material. Simply Wall St has no position in any stocks mentioned.
Join A Paid User Research Session
You’ll receive a US$30 Amazon Gift card for 1 hour of your time while helping us build better investing tools for the individual investors like yourself. Sign up here
