
 Yahoo Movies
 Do You Like Chemung Financial Corporation (NASDAQ:CHMG) At This P/E Ratio?

Want to participate in a short research study? Help shape the future of investing tools and you could win a $250 gift card!
This article is written for those who want to get better at using price to earnings ratios (P/E ratios). We'll show how you can use Chemung Financial Corporation's (NASDAQ:CHMG) P/E ratio to inform your assessment of the investment opportunity. Chemung Financial has a price to earnings ratio of 11.82, based on the last twelve months. That means that at current prices, buyers pay $11.82 for every $1 in trailing yearly profits.
View our latest analysis for Chemung Financial
How Do You Calculate A P/E Ratio?
The formula for price to earnings is:
Price to Earnings Ratio = Share Price ÷ Earnings per Share (EPS)
Or for Chemung Financial:
P/E of 11.82 = $47.98 ÷ $4.06 (Based on the trailing twelve months to March 2019.)
Is A High P/E Ratio Good?
The higher the P/E ratio, the higher the price tag of a business, relative to its trailing earnings. That isn't a good or a bad thing on its own, but a high P/E means that buyers have a higher opinion of the business's prospects, relative to stocks with a lower P/E.
How Growth Rates Impact P/E Ratios
P/E ratios primarily reflect market expectations around earnings growth rates. When earnings grow, the 'E' increases, over time. Therefore, even if you pay a high multiple of earnings now, that multiple will become lower in the future. And as that P/E ratio drops, the company will look cheap, unless its share price increases.
In the last year, Chemung Financial grew EPS like Taylor Swift grew her fan base back in 2010; the 120% gain was both fast and well deserved. The cherry on top is that the five year growth rate was an impressive 18% per year. With that kind of growth rate we would generally expect a high P/E ratio.
Does Chemung Financial Have A Relatively High Or Low P/E For Its Industry?
One good way to get a quick read on what market participants expect of a company is to look at its P/E ratio. We can see in the image below that the average P/E (13) for companies in the banks industry is higher than Chemung Financial's P/E.
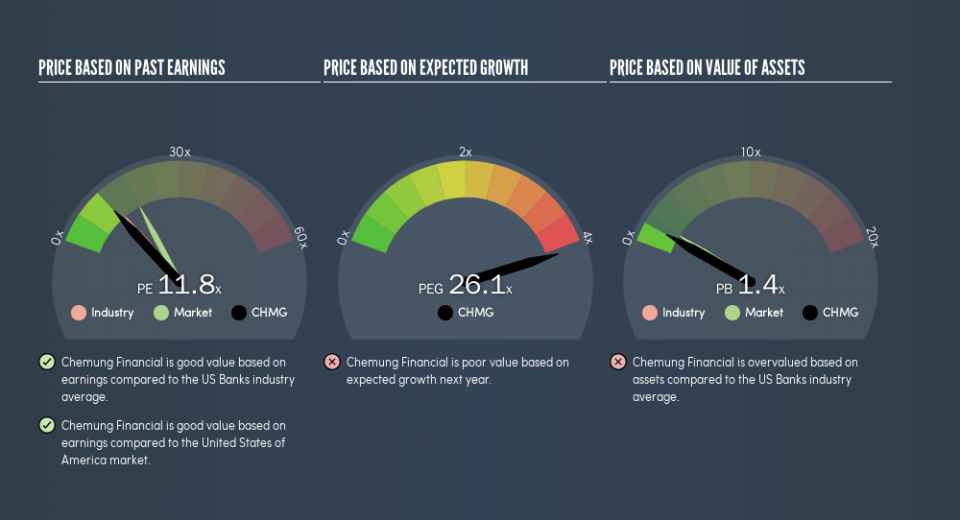
This suggests that market participants think Chemung Financial will underperform other companies in its industry. Many investors like to buy stocks when the market is pessimistic about their prospects. You should delve deeper. I like to check if company insiders have been buying or selling.
Remember: P/E Ratios Don't Consider The Balance Sheet
It's important to note that the P/E ratio considers the market capitalization, not the enterprise value. In other words, it does not consider any debt or cash that the company may have on the balance sheet. The exact same company would hypothetically deserve a higher P/E ratio if it had a strong balance sheet, than if it had a weak one with lots of debt, because a cashed up company can spend on growth.
Such expenditure might be good or bad, in the long term, but the point here is that the balance sheet is not reflected by this ratio.
Chemung Financial's Balance Sheet
Chemung Financial has net cash of US$115m. This is fairly high at 50% of its market capitalization. That might mean balance sheet strength is important to the business, but should also help push the P/E a bit higher than it would otherwise be.
The Bottom Line On Chemung Financial's P/E Ratio
Chemung Financial trades on a P/E ratio of 11.8, which is below the US market average of 18. It grew its EPS nicely over the last year, and the healthy balance sheet implies there is more potential for growth. The below average P/E ratio suggests that market participants don't believe the strong growth will continue.
When the market is wrong about a stock, it gives savvy investors an opportunity. As value investor Benjamin Graham famously said, 'In the short run, the market is a voting machine but in the long run, it is a weighing machine.' So this free report on the analyst consensus forecasts could help you make a master move on this stock.
But note: Chemung Financial may not be the best stock to buy. So take a peek at this free list of interesting companies with strong recent earnings growth (and a P/E ratio below 20).
We aim to bring you long-term focused research analysis driven by fundamental data. Note that our analysis may not factor in the latest price-sensitive company announcements or qualitative material.
If you spot an error that warrants correction, please contact the editor at editorial-team@simplywallst.com. This article by Simply Wall St is general in nature. It does not constitute a recommendation to buy or sell any stock, and does not take account of your objectives, or your financial situation. Simply Wall St has no position in the stocks mentioned. Thank you for reading.

