
 Yahoo Movies
 Does The Market Have A Low Tolerance For Dorman Products, Inc.'s (NASDAQ:DORM) Mixed Fundamentals?
With its stock down 8.5% over the past three months, it is easy to disregard Dorman Products (NASDAQ:DORM). It seems that the market might have completely ignored the positive aspects of the company's fundamentals and decided to weigh-in more on the negative aspects. Stock prices are usually driven by a company’s financial performance over the long term, and therefore we decided to pay more attention to the company's financial performance. Specifically, we decided to study Dorman Products' ROE in this article.
Return on equity or ROE is an important factor to be considered by a shareholder because it tells them how effectively their capital is being reinvested. Put another way, it reveals the company's success at turning shareholder investments into profits.
See our latest analysis for Dorman Products
How To Calculate Return On Equity?
The formula for ROE is:
Return on Equity = Net Profit (from continuing operations) ÷ Shareholders' Equity
So, based on the above formula, the ROE for Dorman Products is:
8.8% = US$92m ÷ US$1.0b (Based on the trailing twelve months to April 2023).
The 'return' is the income the business earned over the last year. Another way to think of that is that for every $1 worth of equity, the company was able to earn $0.09 in profit.
Why Is ROE Important For Earnings Growth?
We have already established that ROE serves as an efficient profit-generating gauge for a company's future earnings. We now need to evaluate how much profit the company reinvests or "retains" for future growth which then gives us an idea about the growth potential of the company. Assuming all else is equal, companies that have both a higher return on equity and higher profit retention are usually the ones that have a higher growth rate when compared to companies that don't have the same features.
A Side By Side comparison of Dorman Products' Earnings Growth And 8.8% ROE
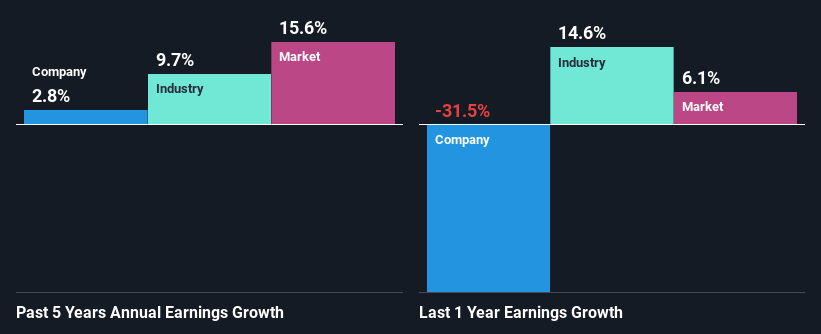
At first glance, Dorman Products' ROE doesn't look very promising. A quick further study shows that the company's ROE doesn't compare favorably to the industry average of 14% either. As a result, Dorman Products reported a very low income growth of 2.8% over the past five years.
Next, on comparing with the industry net income growth, we found that Dorman Products' reported growth was lower than the industry growth of 9.7% in the same period, which is not something we like to see.
Earnings growth is an important metric to consider when valuing a stock. The investor should try to establish if the expected growth or decline in earnings, whichever the case may be, is priced in. This then helps them determine if the stock is placed for a bright or bleak future. Is Dorman Products fairly valued compared to other companies? These 3 valuation measures might help you decide.
Is Dorman Products Efficiently Re-investing Its Profits?
Dorman Products doesn't pay any dividend, which means that it is retaining all of its earnings. However, there's only been very little earnings growth to show for it. So there could be some other explanation in that regard. For instance, the company's business may be deteriorating.
Summary
On the whole, we feel that the performance shown by Dorman Products can be open to many interpretations. Even though it appears to be retaining most of its profits, given the low ROE, investors may not be benefitting from all that reinvestment after all. The low earnings growth suggests our theory correct. Wrapping up, we would proceed with caution with this company and one way of doing that would be to look at the risk profile of the business. To know the 2 risks we have identified for Dorman Products visit our risks dashboard for free.
Have feedback on this article? Concerned about the content? Get in touch with us directly. Alternatively, email editorial-team (at) simplywallst.com.
This article by Simply Wall St is general in nature. We provide commentary based on historical data and analyst forecasts only using an unbiased methodology and our articles are not intended to be financial advice. It does not constitute a recommendation to buy or sell any stock, and does not take account of your objectives, or your financial situation. We aim to bring you long-term focused analysis driven by fundamental data. Note that our analysis may not factor in the latest price-sensitive company announcements or qualitative material. Simply Wall St has no position in any stocks mentioned.
Join A Paid User Research Session
You’ll receive a US$30 Amazon Gift card for 1 hour of your time while helping us build better investing tools for the individual investors like yourself. Sign up here

