
 Yahoo Movies
 Here's How P/E Ratios Can Help Us Understand John B. Sanfilippo & Son, Inc. (NASDAQ:JBSS)

This article is written for those who want to get better at using price to earnings ratios (P/E ratios). To keep it practical, we'll show how John B. Sanfilippo & Son, Inc.'s (NASDAQ:JBSS) P/E ratio could help you assess the value on offer. John B. Sanfilippo & Son has a price to earnings ratio of 22.81, based on the last twelve months. That is equivalent to an earnings yield of about 4.4%.
Check out our latest analysis for John B. Sanfilippo & Son
How Do I Calculate A Price To Earnings Ratio?
The formula for P/E is:
Price to Earnings Ratio = Price per Share ÷ Earnings per Share (EPS)
Or for John B. Sanfilippo & Son:
P/E of 22.81 = $91.28 ÷ $4.00 (Based on the trailing twelve months to September 2019.)
Is A High Price-to-Earnings Ratio Good?
The higher the P/E ratio, the higher the price tag of a business, relative to its trailing earnings. That isn't necessarily good or bad, but a high P/E implies relatively high expectations of what a company can achieve in the future.
Does John B. Sanfilippo & Son Have A Relatively High Or Low P/E For Its Industry?
We can get an indication of market expectations by looking at the P/E ratio. The image below shows that John B. Sanfilippo & Son has a lower P/E than the average (25.1) P/E for companies in the food industry.
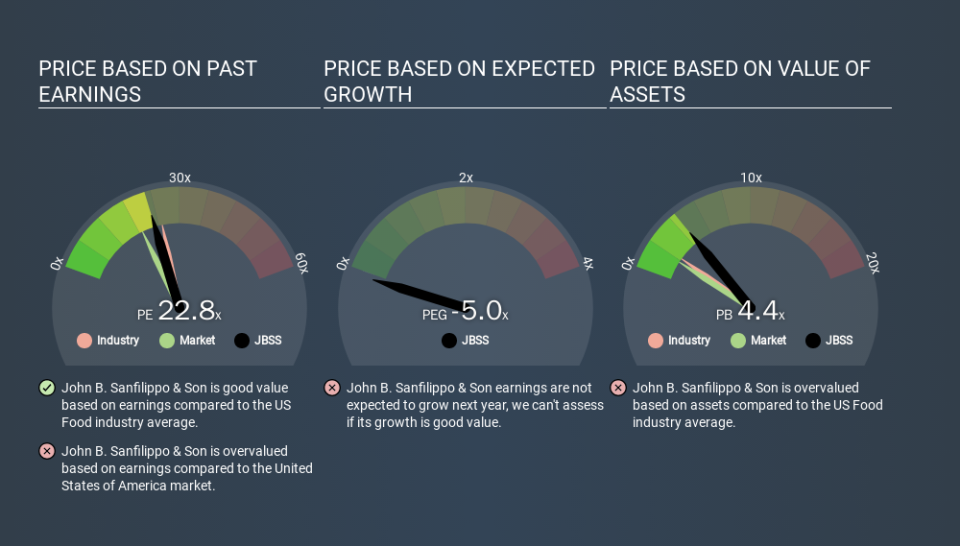
John B. Sanfilippo & Son's P/E tells us that market participants think it will not fare as well as its peers in the same industry. Many investors like to buy stocks when the market is pessimistic about their prospects. It is arguably worth checking if insiders are buying shares, because that might imply they believe the stock is undervalued.
How Growth Rates Impact P/E Ratios
Earnings growth rates have a big influence on P/E ratios. When earnings grow, the 'E' increases, over time. And in that case, the P/E ratio itself will drop rather quickly. So while a stock may look expensive based on past earnings, it could be cheap based on future earnings.
John B. Sanfilippo & Son's earnings made like a rocket, taking off 60% last year. Having said that, the average EPS growth over the last three years wasn't so good, coming in at 11%.
Remember: P/E Ratios Don't Consider The Balance Sheet
Don't forget that the P/E ratio considers market capitalization. Thus, the metric does not reflect cash or debt held by the company. In theory, a company can lower its future P/E ratio by using cash or debt to invest in growth.
While growth expenditure doesn't always pay off, the point is that it is a good option to have; but one that the P/E ratio ignores.
Is Debt Impacting John B. Sanfilippo & Son's P/E?
John B. Sanfilippo & Son's net debt is 4.0% of its market cap. It would probably trade on a higher P/E ratio if it had a lot of cash, but I doubt it is having a big impact.
The Verdict On John B. Sanfilippo & Son's P/E Ratio
John B. Sanfilippo & Son's P/E is 22.8 which is above average (18.9) in its market. The company is not overly constrained by its modest debt levels, and its recent EPS growth is nothing short of stand-out. So to be frank we are not surprised it has a high P/E ratio.
When the market is wrong about a stock, it gives savvy investors an opportunity. If the reality for a company is better than it expects, you can make money by buying and holding for the long term. So this free report on the analyst consensus forecasts could help you make a master move on this stock.
Of course you might be able to find a better stock than John B. Sanfilippo & Son. So you may wish to see this free collection of other companies that have grown earnings strongly.
If you spot an error that warrants correction, please contact the editor at editorial-team@simplywallst.com. This article by Simply Wall St is general in nature. It does not constitute a recommendation to buy or sell any stock, and does not take account of your objectives, or your financial situation. Simply Wall St has no position in the stocks mentioned.
We aim to bring you long-term focused research analysis driven by fundamental data. Note that our analysis may not factor in the latest price-sensitive company announcements or qualitative material. Thank you for reading.

