
 Yahoo Movies
 Here's Why Under Armour (NYSE:UAA) Can Manage Its Debt Responsibly
Legendary fund manager Li Lu (who Charlie Munger backed) once said, 'The biggest investment risk is not the volatility of prices, but whether you will suffer a permanent loss of capital.' It's only natural to consider a company's balance sheet when you examine how risky it is, since debt is often involved when a business collapses. As with many other companies Under Armour, Inc. (NYSE:UAA) makes use of debt. But the more important question is: how much risk is that debt creating?
What Risk Does Debt Bring?
Generally speaking, debt only becomes a real problem when a company can't easily pay it off, either by raising capital or with its own cash flow. Ultimately, if the company can't fulfill its legal obligations to repay debt, shareholders could walk away with nothing. However, a more usual (but still expensive) situation is where a company must dilute shareholders at a cheap share price simply to get debt under control. Of course, debt can be an important tool in businesses, particularly capital heavy businesses. When we think about a company's use of debt, we first look at cash and debt together.
View our latest analysis for Under Armour
What Is Under Armour's Debt?
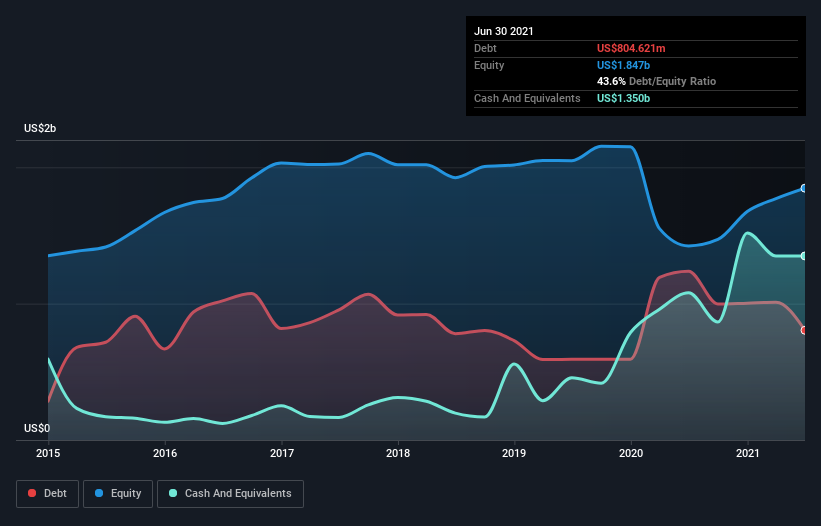
The image below, which you can click on for greater detail, shows that Under Armour had debt of US$804.6m at the end of June 2021, a reduction from US$1.24b over a year. However, its balance sheet shows it holds US$1.35b in cash, so it actually has US$545.2m net cash.
A Look At Under Armour's Liabilities
We can see from the most recent balance sheet that Under Armour had liabilities of US$1.36b falling due within a year, and liabilities of US$1.66b due beyond that. Offsetting this, it had US$1.35b in cash and US$642.9m in receivables that were due within 12 months. So it has liabilities totalling US$1.03b more than its cash and near-term receivables, combined.
Of course, Under Armour has a market capitalization of US$9.25b, so these liabilities are probably manageable. Having said that, it's clear that we should continue to monitor its balance sheet, lest it change for the worse. While it does have liabilities worth noting, Under Armour also has more cash than debt, so we're pretty confident it can manage its debt safely.
Although Under Armour made a loss at the EBIT level, last year, it was also good to see that it generated US$486m in EBIT over the last twelve months. When analysing debt levels, the balance sheet is the obvious place to start. But ultimately the future profitability of the business will decide if Under Armour can strengthen its balance sheet over time. So if you want to see what the professionals think, you might find this free report on analyst profit forecasts to be interesting.
Finally, while the tax-man may adore accounting profits, lenders only accept cold hard cash. Under Armour may have net cash on the balance sheet, but it is still interesting to look at how well the business converts its earnings before interest and tax (EBIT) to free cash flow, because that will influence both its need for, and its capacity to manage debt. Happily for any shareholders, Under Armour actually produced more free cash flow than EBIT over the last year. That sort of strong cash generation warms our hearts like a puppy in a bumblebee suit.
Summing up
Although Under Armour's balance sheet isn't particularly strong, due to the total liabilities, it is clearly positive to see that it has net cash of US$545.2m. The cherry on top was that in converted 114% of that EBIT to free cash flow, bringing in US$555m. So is Under Armour's debt a risk? It doesn't seem so to us. There's no doubt that we learn most about debt from the balance sheet. However, not all investment risk resides within the balance sheet - far from it. For example, we've discovered 3 warning signs for Under Armour that you should be aware of before investing here.
Of course, if you're the type of investor who prefers buying stocks without the burden of debt, then don't hesitate to discover our exclusive list of net cash growth stocks, today.
This article by Simply Wall St is general in nature. We provide commentary based on historical data and analyst forecasts only using an unbiased methodology and our articles are not intended to be financial advice. It does not constitute a recommendation to buy or sell any stock, and does not take account of your objectives, or your financial situation. We aim to bring you long-term focused analysis driven by fundamental data. Note that our analysis may not factor in the latest price-sensitive company announcements or qualitative material. Simply Wall St has no position in any stocks mentioned.
Have feedback on this article? Concerned about the content? Get in touch with us directly. Alternatively, email editorial-team (at) simplywallst.com.

