
 Yahoo Movies
 What Investors Should Know About Church & Dwight Co Inc’s (NYSE:CHD) Financial Strength

The size of Church & Dwight Co Inc (NYSE:CHD), a US$13.79b large-cap, often attracts investors seeking a reliable investment in the stock market. Doing business globally, large caps tend to have diversified revenue streams and attractive capital returns, making them desirable investments for risk-averse portfolios. However, the key to extending previous success is in the health of the company’s financials. I will provide an overview of Church & Dwight’s financial liquidity and leverage to give you an idea of Church & Dwight’s position to take advantage of potential acquisitions or comfortably endure future downturns. Remember this is a very top-level look that focuses exclusively on financial health, so I recommend a deeper analysis into CHD here.
See our latest analysis for Church & Dwight
How does CHD’s operating cash flow stack up against its debt?
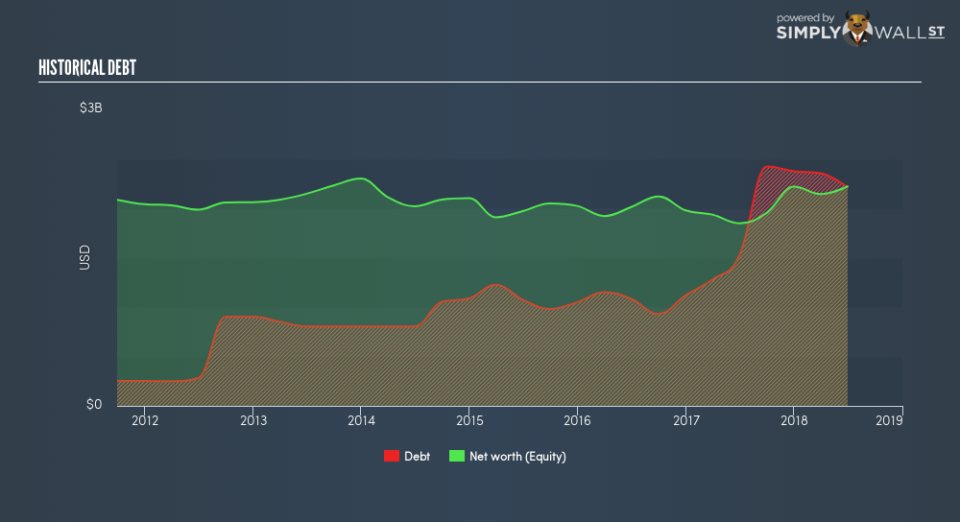
CHD’s debt levels surged from US$1.52b to US$2.21b over the last 12 months , which is made up of current and long term debt. With this rise in debt, CHD currently has US$89.3m remaining in cash and short-term investments for investing into the business. Moreover, CHD has generated US$754.9m in operating cash flow over the same time period, leading to an operating cash to total debt ratio of 34.1%, indicating that CHD’s current level of operating cash is high enough to cover debt. This ratio can also be interpreted as a measure of efficiency as an alternative to return on assets. In CHD’s case, it is able to generate 0.34x cash from its debt capital.
Does CHD’s liquid assets cover its short-term commitments?
With current liabilities at US$1.10b, it appears that the company has not maintained a sufficient level of current assets to meet its obligations, with the current ratio last standing at 0.79x, which is below the prudent industry ratio of 3x.
Is CHD’s debt level acceptable?
With a debt-to-equity ratio of 99.6%, CHD can be considered as an above-average leveraged company. This isn’t surprising for large-caps, as equity can often be more expensive to issue than debt, plus interest payments are tax deductible. Accordingly, large companies often have lower cost of capital due to easily obtained financing, providing an advantage over smaller companies. By measuring how many times CHD’s earnings can cover interest payments, we can evaluate whether its level of debt is sustainable or not. A company generating earnings before interest and tax (EBIT) at least three times its net interest payments is considered financially sound. In CHD’s case, the ratio of 11x suggests that interest is comfortably covered. High interest coverage is seen as a responsible and safe practice, which highlights why most investors believe large-caps such as CHD is a safe investment.
Next Steps:
CHD’s high cash coverage means that, although its debt levels are high, the company is able to utilise its borrowings efficiently in order to generate cash flow. But, its low liquidity raises concerns over whether current asset management practices are properly implemented for the large-cap. Keep in mind I haven’t considered other factors such as how CHD has been performing in the past. I suggest you continue to research Church & Dwight to get a better picture of the stock by looking at:
Future Outlook: What are well-informed industry analysts predicting for CHD’s future growth? Take a look at our free research report of analyst consensus for CHD’s outlook.
Valuation: What is CHD worth today? Is the stock undervalued, even when its growth outlook is factored into its intrinsic value? The intrinsic value infographic in our free research report helps visualize whether CHD is currently mispriced by the market.
Other High-Performing Stocks: Are there other stocks that provide better prospects with proven track records? Explore our free list of these great stocks here.
To help readers see past the short term volatility of the financial market, we aim to bring you a long-term focused research analysis purely driven by fundamental data. Note that our analysis does not factor in the latest price-sensitive company announcements.
The author is an independent contributor and at the time of publication had no position in the stocks mentioned. For errors that warrant correction please contact the editor at editorial-team@simplywallst.com.

