
 Yahoo Movies
 What You Need To Know About Baidu, Inc.'s (NASDAQ:BIDU) Investor Composition
Every investor in Baidu, Inc. (NASDAQ:BIDU) should be aware of the most powerful shareholder groups. Insiders often own a large chunk of younger, smaller, companies while huge companies tend to have institutions as shareholders. I quite like to see at least a little bit of insider ownership. As Charlie Munger said 'Show me the incentive and I will show you the outcome.
With a market capitalization of US$53b, Baidu is rather large. We'd expect to see institutional investors on the register. Companies of this size are usually well known to retail investors, too. Our analysis of the ownership of the company, below, shows that institutional investors have bought into the company. We can zoom in on the different ownership groups, to learn more about Baidu.
Check out our latest analysis for Baidu
What Does The Institutional Ownership Tell Us About Baidu?
Many institutions measure their performance against an index that approximates the local market. So they usually pay more attention to companies that are included in major indices.
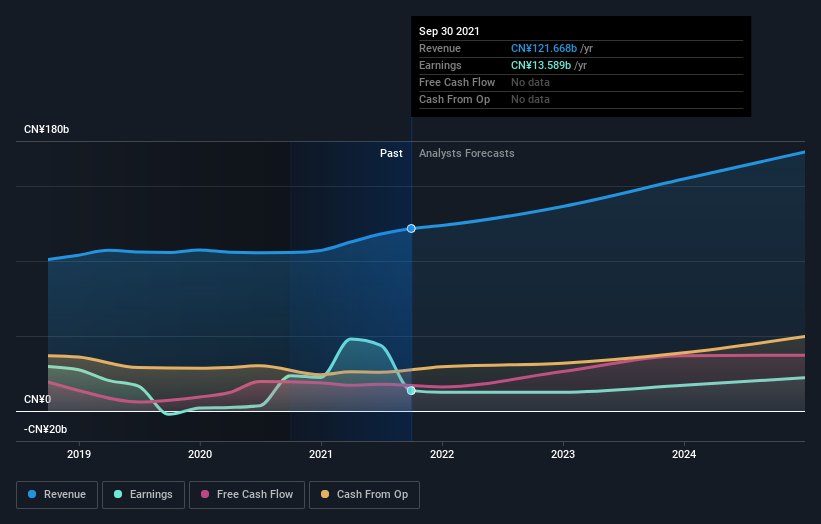
Baidu already has institutions on the share registry. Indeed, they own a respectable stake in the company. This implies the analysts working for those institutions have looked at the stock and they like it. But just like anyone else, they could be wrong. When multiple institutions own a stock, there's always a risk that they are in a 'crowded trade'. When such a trade goes wrong, multiple parties may compete to sell stock fast. This risk is higher in a company without a history of growth. You can see Baidu's historic earnings and revenue below, but keep in mind there's always more to the story.
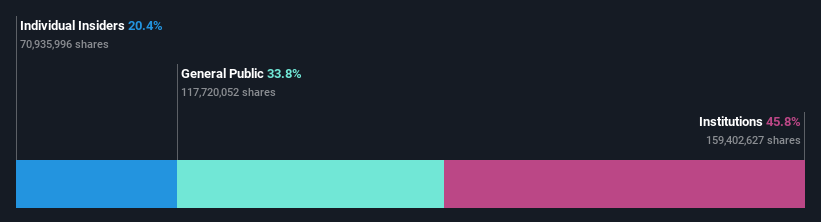
We note that hedge funds don't have a meaningful investment in Baidu. With a 20% stake, CEO Yanhong Li is the largest shareholder. Meanwhile, the second and third largest shareholders, hold 4.3% and 3.0%, of the shares outstanding, respectively.
Our studies suggest that the top 25 shareholders collectively control less than half of the company's shares, meaning that the company's shares are widely disseminated and there is no dominant shareholder.
While it makes sense to study institutional ownership data for a company, it also makes sense to study analyst sentiments to know which way the wind is blowing. There are plenty of analysts covering the stock, so it might be worth seeing what they are forecasting, too.
Insider Ownership Of Baidu
The definition of company insiders can be subjective and does vary between jurisdictions. Our data reflects individual insiders, capturing board members at the very least. Company management run the business, but the CEO will answer to the board, even if he or she is a member of it.
Most consider insider ownership a positive because it can indicate the board is well aligned with other shareholders. However, on some occasions too much power is concentrated within this group.
Our information suggests that insiders maintain a significant holding in Baidu, Inc.. It has a market capitalization of just US$53b, and insiders have US$11b worth of shares in their own names. That's quite significant. Most would be pleased to see the board is investing alongside them. You may wish to access this free chart showing recent trading by insiders.
General Public Ownership
With a 34% ownership, the general public, mostly comprising of individual investors, have some degree of sway over Baidu. This size of ownership, while considerable, may not be enough to change company policy if the decision is not in sync with other large shareholders.
Next Steps:
It's always worth thinking about the different groups who own shares in a company. But to understand Baidu better, we need to consider many other factors. For example, we've discovered 3 warning signs for Baidu that you should be aware of before investing here.
Ultimately the future is most important. You can access this free report on analyst forecasts for the company.
NB: Figures in this article are calculated using data from the last twelve months, which refer to the 12-month period ending on the last date of the month the financial statement is dated. This may not be consistent with full year annual report figures.
Have feedback on this article? Concerned about the content? Get in touch with us directly. Alternatively, email editorial-team (at) simplywallst.com.
This article by Simply Wall St is general in nature. We provide commentary based on historical data and analyst forecasts only using an unbiased methodology and our articles are not intended to be financial advice. It does not constitute a recommendation to buy or sell any stock, and does not take account of your objectives, or your financial situation. We aim to bring you long-term focused analysis driven by fundamental data. Note that our analysis may not factor in the latest price-sensitive company announcements or qualitative material. Simply Wall St has no position in any stocks mentioned.

