
 Yahoo Movies
 Do You Like ResMed Inc. (NYSE:RMD) At This P/E Ratio?

The goal of this article is to teach you how to use price to earnings ratios (P/E ratios). We’ll show how you can use ResMed Inc.’s (NYSE:RMD) P/E ratio to inform your assessment of the investment opportunity. Based on the last twelve months, ResMed’s P/E ratio is 32.18. That is equivalent to an earnings yield of about 3.1%.
See our latest analysis for ResMed
How Do I Calculate ResMed’s Price To Earnings Ratio?
The formula for P/E is:
Price to Earnings Ratio = Share Price ÷ Earnings per Share (EPS)
Or for ResMed:
P/E of 32.18 = $101.4 ÷ $3.15 (Based on the year to December 2018.)
Is A High Price-to-Earnings Ratio Good?
A higher P/E ratio implies that investors pay a higher price for the earning power of the business. That isn’t necessarily good or bad, but a high P/E implies relatively high expectations of what a company can achieve in the future.
How Growth Rates Impact P/E Ratios
Earnings growth rates have a big influence on P/E ratios. Earnings growth means that in the future the ‘E’ will be higher. Therefore, even if you pay a high multiple of earnings now, that multiple will become lower in the future. So while a stock may look expensive based on past earnings, it could be cheap based on future earnings.
It’s nice to see that ResMed grew EPS by a stonking 57% in the last year.
How Does ResMed’s P/E Ratio Compare To Its Peers?
We can get an indication of market expectations by looking at the P/E ratio. If you look at the image below, you can see ResMed has a lower P/E than the average (39.5) in the medical equipment industry classification.
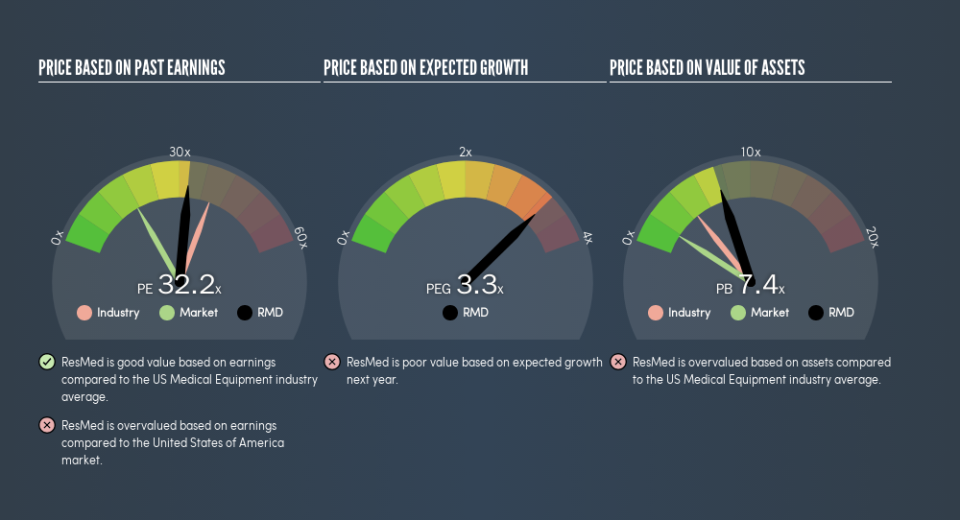
ResMed’s P/E tells us that market participants think it will not fare as well as its peers in the same industry. While current expectations are low, the stock could be undervalued if the situation is better than the market assumes. You should delve deeper. I like to check if company insiders have been buying or selling.
Don’t Forget: The P/E Does Not Account For Debt or Bank Deposits
Don’t forget that the P/E ratio considers market capitalization. Thus, the metric does not reflect cash or debt held by the company. In theory, a company can lower its future P/E ratio by using cash or debt to invest in growth.
Spending on growth might be good or bad a few years later, but the point is that the P/E ratio does not account for the option (or lack thereof).
ResMed’s Balance Sheet
ResMed’s net debt is 7.2% of its market cap. It would probably trade on a higher P/E ratio if it had a lot of cash, but I doubt it is having a big impact.
The Bottom Line On ResMed’s P/E Ratio
ResMed has a P/E of 32.2. That’s higher than the average in the US market, which is 17.5. The company is not overly constrained by its modest debt levels, and it is growing earnings per share. Therefore it seems reasonable that the market would have relatively high expectations of the company
Investors should be looking to buy stocks that the market is wrong about. People often underestimate remarkable growth — so investors can make money when fast growth is not fully appreciated. So this free visual report on analyst forecasts could hold the key to an excellent investment decision.
Of course you might be able to find a better stock than ResMed. So you may wish to see this free collection of other companies that have grown earnings strongly.
We aim to bring you long-term focused research analysis driven by fundamental data. Note that our analysis may not factor in the latest price-sensitive company announcements or qualitative material.
If you spot an error that warrants correction, please contact the editor at editorial-team@simplywallst.com. This article by Simply Wall St is general in nature. It does not constitute a recommendation to buy or sell any stock, and does not take account of your objectives, or your financial situation. Simply Wall St has no position in the stocks mentioned. Thank you for reading.

