
 Yahoo Movies
 Should You Be Tempted To Sell LendingTree Inc (NASDAQ:TREE) Because Of Its PE Ratio?

I am writing today to help inform people who are new to the stock market and want to learn about the link between company’s fundamentals and stock market performance.
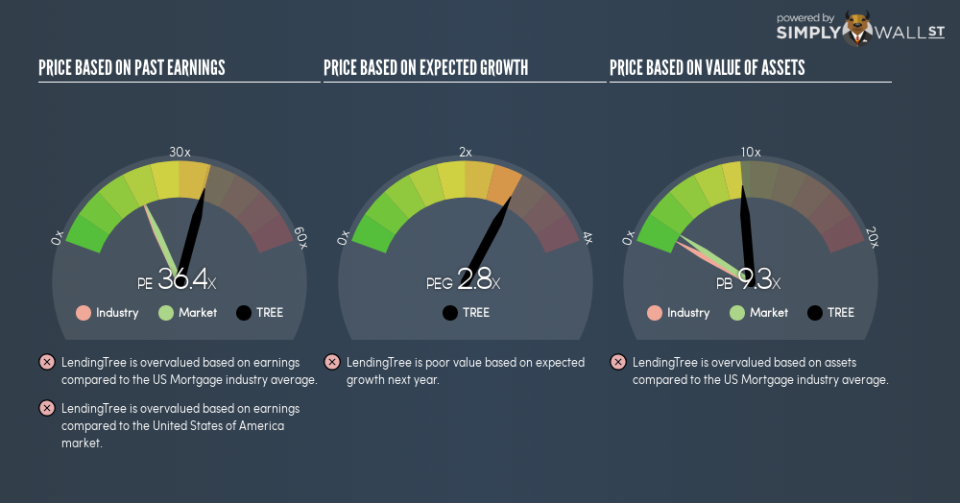
LendingTree Inc (NASDAQ:TREE) is currently trading at a trailing P/E of 36.4, which is higher than the industry average of 19.4. Though this might seem to be a negative, you might change your mind after I explain the assumptions behind the P/E ratio. Today, I will deconstruct the P/E ratio and highlight what you need to be careful of when using the P/E ratio.
See our latest analysis for LendingTree
Demystifying the P/E ratio
The P/E ratio is a popular ratio used in relative valuation since earnings power is a key driver of investment value. By comparing a stock’s price per share to its earnings per share, we are able to see how much investors are paying for each dollar of the company’s earnings.
P/E Calculation for TREE
Price-Earnings Ratio = Price per share ÷ Earnings per share
TREE Price-Earnings Ratio = $253.35 ÷ $6.955 = 36.4x
The P/E ratio itself doesn’t tell you a lot; however, it becomes very insightful when you compare it with other similar companies. We preferably want to compare the stock’s P/E ratio to the average of companies that have similar features to TREE, such as capital structure and profitability. One way of gathering a peer group is to use firms in the same industry, which is what I’ll do. At 36.4, TREE’s P/E is higher than its industry peers (19.4). This implies that investors are overvaluing each dollar of TREE’s earnings. This multiple is a median of profitable companies of 25 Mortgage companies in US including Solutions Group, Security National Financial and PennyMac Financial Services. You could think of it like this: the market is pricing TREE as if it is a stronger company than the average of its industry group.
Assumptions to watch out for
However, you should be aware that this analysis makes certain assumptions. Firstly, that our peer group contains companies that are similar to TREE. If this isn’t the case, the difference in P/E could be due to other factors. For example, if LendingTree Inc is growing faster than its peers, then it would deserve a higher P/E ratio. Of course, it is possible that the stocks we are comparing with TREE are not fairly valued. So while we can reasonably surmise that it is optimistically valued relative to a peer group, it might be fairly valued, if the peer group is undervalued.
What this means for you:
Since you may have already conducted your due diligence on TREE, the overvaluation of the stock may mean it is a good time to reduce your current holdings. But at the end of the day, keep in mind that relative valuation relies heavily on critical assumptions I’ve outlined above. Remember that basing your investment decision off one metric alone is certainly not sufficient. There are many things I have not taken into account in this article and the PE ratio is very one-dimensional. If you have not done so already, I urge you to complete your research by taking a look at the following:
Future Outlook: What are well-informed industry analysts predicting for TREE’s future growth? Take a look at our free research report of analyst consensus for TREE’s outlook.
Past Track Record: Has TREE been consistently performing well irrespective of the ups and downs in the market? Go into more detail in the past performance analysis and take a look at the free visual representations of TREE’s historicals for more clarity.
Other High-Performing Stocks: Are there other stocks that provide better prospects with proven track records? Explore our free list of these great stocks here.
To help readers see past the short term volatility of the financial market, we aim to bring you a long-term focused research analysis purely driven by fundamental data. Note that our analysis does not factor in the latest price-sensitive company announcements.
The author is an independent contributor and at the time of publication had no position in the stocks mentioned. For errors that warrant correction please contact the editor at editorial-team@simplywallst.com.

