
 Yahoo Movies
 What Is Wendy's's (NASDAQ:WEN) P/E Ratio After Its Share Price Tanked?

To the annoyance of some shareholders, Wendy's (NASDAQ:WEN) shares are down a considerable 46% in the last month. The recent drop has obliterated the annual return, with the share price now down 25% over that longer period.
Assuming nothing else has changed, a lower share price makes a stock more attractive to potential buyers. While the market sentiment towards a stock is very changeable, in the long run, the share price will tend to move in the same direction as earnings per share. The implication here is that long term investors have an opportunity when expectations of a company are too low. One way to gauge market expectations of a stock is to look at its Price to Earnings Ratio (PE Ratio). A high P/E ratio means that investors have a high expectation about future growth, while a low P/E ratio means they have low expectations about future growth.
Check out our latest analysis for Wendy's
How Does Wendy's's P/E Ratio Compare To Its Peers?
We can tell from its P/E ratio of 20.74 that there is some investor optimism about Wendy's. The image below shows that Wendy's has a higher P/E than the average (13.2) P/E for companies in the hospitality industry.
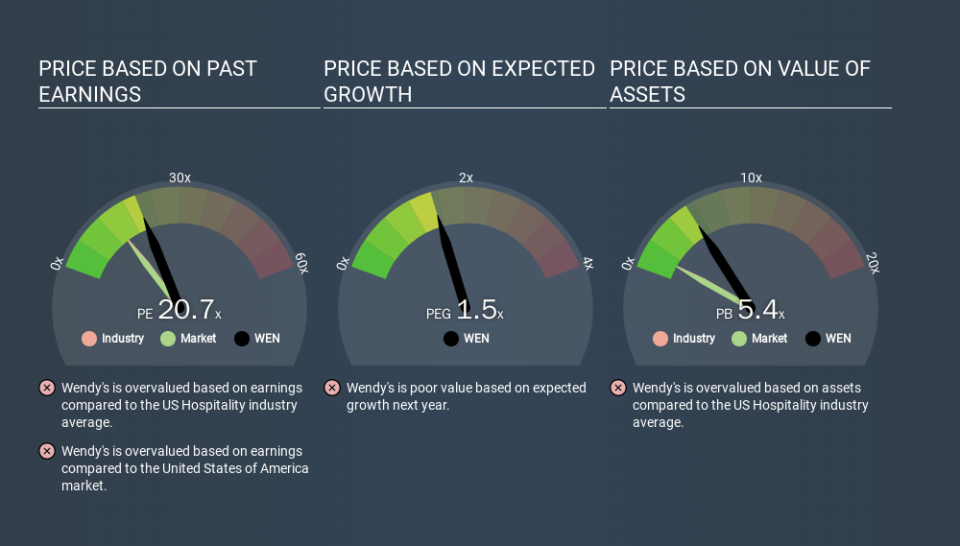
That means that the market expects Wendy's will outperform other companies in its industry. Clearly the market expects growth, but it isn't guaranteed. So investors should delve deeper. I like to check if company insiders have been buying or selling.
How Growth Rates Impact P/E Ratios
Earnings growth rates have a big influence on P/E ratios. When earnings grow, the 'E' increases, over time. And in that case, the P/E ratio itself will drop rather quickly. A lower P/E should indicate the stock is cheap relative to others -- and that may attract buyers.
Wendy's saw earnings per share decrease by 69% last year. But over the longer term (5 years) earnings per share have increased by 14%.
Remember: P/E Ratios Don't Consider The Balance Sheet
One drawback of using a P/E ratio is that it considers market capitalization, but not the balance sheet. In other words, it does not consider any debt or cash that the company may have on the balance sheet. In theory, a company can lower its future P/E ratio by using cash or debt to invest in growth.
Such spending might be good or bad, overall, but the key point here is that you need to look at debt to understand the P/E ratio in context.
Is Debt Impacting Wendy's's P/E?
Wendy's has net debt worth 72% of its market capitalization. This is a reasonably significant level of debt -- all else being equal you'd expect a much lower P/E than if it had net cash.
The Bottom Line On Wendy's's P/E Ratio
Wendy's has a P/E of 20.7. That's higher than the average in its market, which is 12.7. With meaningful debt and a lack of recent earnings growth, the market has high expectations that the business will earn more in the future. Given Wendy's's P/E ratio has declined from 38.5 to 20.7 in the last month, we know for sure that the market is significantly less confident about the business today, than it was back then. For those who don't like to trade against momentum, that could be a warning sign, but a contrarian investor might want to take a closer look.
Investors should be looking to buy stocks that the market is wrong about. As value investor Benjamin Graham famously said, 'In the short run, the market is a voting machine but in the long run, it is a weighing machine. So this free visualization of the analyst consensus on future earnings could help you make the right decision about whether to buy, sell, or hold.
Of course you might be able to find a better stock than Wendy's. So you may wish to see this free collection of other companies that have grown earnings strongly.
If you spot an error that warrants correction, please contact the editor at editorial-team@simplywallst.com. This article by Simply Wall St is general in nature. It does not constitute a recommendation to buy or sell any stock, and does not take account of your objectives, or your financial situation. Simply Wall St has no position in the stocks mentioned.
We aim to bring you long-term focused research analysis driven by fundamental data. Note that our analysis may not factor in the latest price-sensitive company announcements or qualitative material. Thank you for reading.

