
 Yahoo Movies
 Why EMCOR Group, Inc.’s (NYSE:EME) Return On Capital Employed Is Impressive

Today we’ll evaluate EMCOR Group, Inc. (NYSE:EME) to determine whether it could have potential as an investment idea. Specifically, we’re going to calculate its Return On Capital Employed (ROCE), in the hopes of getting some insight into the business.
First up, we’ll look at what ROCE is and how we calculate it. Next, we’ll compare it to others in its industry. Last but not least, we’ll look at what impact its current liabilities have on its ROCE.
Return On Capital Employed (ROCE): What is it?
ROCE is a metric for evaluating how much pre-tax income (in percentage terms) a company earns on the capital invested in its business. Generally speaking a higher ROCE is better. Overall, it is a valuable metric that has its flaws. Author Edwin Whiting says to be careful when comparing the ROCE of different businesses, since ‘No two businesses are exactly alike.’
So, How Do We Calculate ROCE?
The formula for calculating the return on capital employed is:
Return on Capital Employed = Earnings Before Interest and Tax (EBIT) ÷ (Total Assets – Current Liabilities)
Or for EMCOR Group:
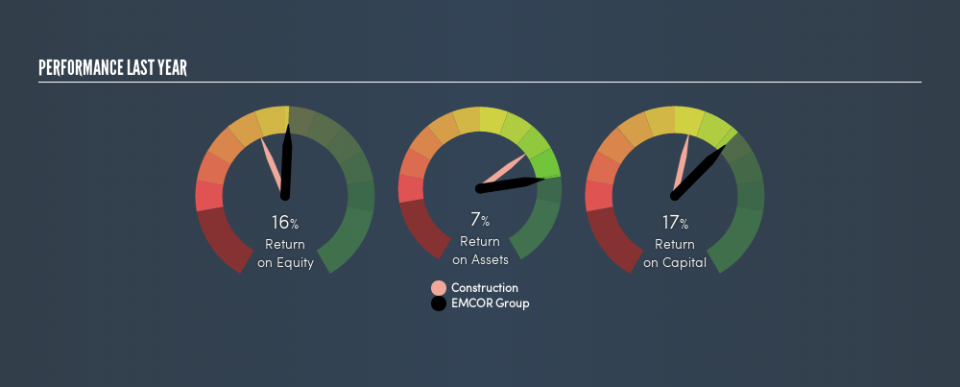
0.17 = US$409m ÷ (US$4.1b – US$1.7b) (Based on the trailing twelve months to December 2018.)
So, EMCOR Group has an ROCE of 17%.
See our latest analysis for EMCOR Group
Is EMCOR Group’s ROCE Good?
ROCE can be useful when making comparisons, such as between similar companies. EMCOR Group’s ROCE appears to be substantially greater than the 9.9% average in the Construction industry. We would consider this a positive, as it suggests it is using capital more effectively than other similar companies. Regardless of where EMCOR Group sits next to its industry, its ROCE in absolute terms appears satisfactory, and this company could be worth a closer look.
Our data shows that EMCOR Group currently has an ROCE of 17%, compared to its ROCE of 14% 3 years ago. This makes us think about whether the company has been reinvesting shrewdly.
Remember that this metric is backwards looking – it shows what has happened in the past, and does not accurately predict the future. Companies in cyclical industries can be difficult to understand using ROCE, as returns typically look high during boom times, and low during busts. ROCE is only a point-in-time measure. Future performance is what matters, and you can see analyst predictions in our free report on analyst forecasts for the company.
Do EMCOR Group’s Current Liabilities Skew Its ROCE?
Liabilities, such as supplier bills and bank overdrafts, are referred to as current liabilities if they need to be paid within 12 months. Due to the way the ROCE equation works, having large bills due in the near term can make it look as though a company has less capital employed, and thus a higher ROCE than usual. To counter this, investors can check if a company has high current liabilities relative to total assets.
EMCOR Group has total liabilities of US$1.7b and total assets of US$4.1b. Therefore its current liabilities are equivalent to approximately 42% of its total assets. EMCOR Group has a medium level of current liabilities, which would boost the ROCE.
What We Can Learn From EMCOR Group’s ROCE
With a decent ROCE, the company could be interesting, but remember that the level of current liabilities make the ROCE look better. You might be able to find a better buy than EMCOR Group. If you want a selection of possible winners, check out this free list of interesting companies that trade on a P/E below 20 (but have proven they can grow earnings).
I will like EMCOR Group better if I see some big insider buys. While we wait, check out this free list of growing companies with considerable, recent, insider buying.
We aim to bring you long-term focused research analysis driven by fundamental data. Note that our analysis may not factor in the latest price-sensitive company announcements or qualitative material.
If you spot an error that warrants correction, please contact the editor at editorial-team@simplywallst.com. This article by Simply Wall St is general in nature. It does not constitute a recommendation to buy or sell any stock, and does not take account of your objectives, or your financial situation. Simply Wall St has no position in the stocks mentioned. Thank you for reading.

