
 Yahoo Movies
 Should You Worry About Olympic Steel, Inc.’s (NASDAQ:ZEUS) ROCE?

Today we are going to look at Olympic Steel, Inc. (NASDAQ:ZEUS) to see whether it might be an attractive investment prospect. In particular, we'll consider its Return On Capital Employed (ROCE), as that can give us insight into how profitably the company is able to employ capital in its business.
First, we'll go over how we calculate ROCE. Next, we'll compare it to others in its industry. And finally, we'll look at how its current liabilities are impacting its ROCE.
What is Return On Capital Employed (ROCE)?
ROCE measures the 'return' (pre-tax profit) a company generates from capital employed in its business. In general, businesses with a higher ROCE are usually better quality. Overall, it is a valuable metric that has its flaws. Renowned investment researcher Michael Mauboussin has suggested that a high ROCE can indicate that 'one dollar invested in the company generates value of more than one dollar'.
How Do You Calculate Return On Capital Employed?
The formula for calculating the return on capital employed is:
Return on Capital Employed = Earnings Before Interest and Tax (EBIT) ÷ (Total Assets - Current Liabilities)
Or for Olympic Steel:
0.03 = US$17m ÷ (US$699m - US$118m) (Based on the trailing twelve months to September 2019.)
So, Olympic Steel has an ROCE of 3.0%.
See our latest analysis for Olympic Steel
Does Olympic Steel Have A Good ROCE?
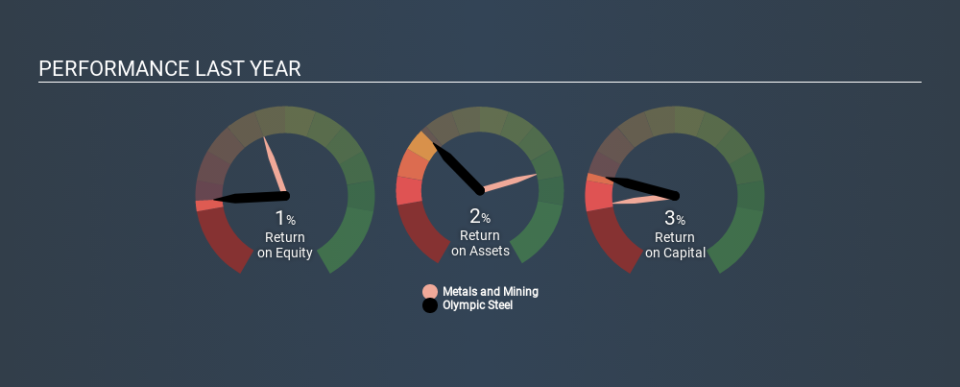
ROCE can be useful when making comparisons, such as between similar companies. Using our data, Olympic Steel's ROCE appears to be significantly below the 8.5% average in the Metals and Mining industry. This could be seen as a negative, as it suggests some competitors may be employing their capital more efficiently. Putting aside Olympic Steel's performance relative to its industry, its ROCE in absolute terms is poor - considering the risk of owning stocks compared to government bonds. Readers may wish to look for more rewarding investments.
In our analysis, Olympic Steel's ROCE appears to be 3.0%, compared to 3 years ago, when its ROCE was 0.4%. This makes us wonder if the company is improving. You can see in the image below how Olympic Steel's ROCE compares to its industry. Click to see more on past growth.
Remember that this metric is backwards looking - it shows what has happened in the past, and does not accurately predict the future. ROCE can be misleading for companies in cyclical industries, with returns looking impressive during the boom times, but very weak during the busts. ROCE is only a point-in-time measure. We note Olympic Steel could be considered a cyclical business. What happens in the future is pretty important for investors, so we have prepared a free report on analyst forecasts for Olympic Steel.
What Are Current Liabilities, And How Do They Affect Olympic Steel's ROCE?
Current liabilities are short term bills and invoices that need to be paid in 12 months or less. Due to the way ROCE is calculated, a high level of current liabilities makes a company look as though it has less capital employed, and thus can (sometimes unfairly) boost the ROCE. To counteract this, we check if a company has high current liabilities, relative to its total assets.
Olympic Steel has total assets of US$699m and current liabilities of US$118m. Therefore its current liabilities are equivalent to approximately 17% of its total assets. With a very reasonable level of current liabilities, so the impact on ROCE is fairly minimal.
What We Can Learn From Olympic Steel's ROCE
That's not a bad thing, however Olympic Steel has a weak ROCE and may not be an attractive investment. You might be able to find a better investment than Olympic Steel. If you want a selection of possible winners, check out this free list of interesting companies that trade on a P/E below 20 (but have proven they can grow earnings).
If you are like me, then you will not want to miss this free list of growing companies that insiders are buying.
If you spot an error that warrants correction, please contact the editor at editorial-team@simplywallst.com. This article by Simply Wall St is general in nature. It does not constitute a recommendation to buy or sell any stock, and does not take account of your objectives, or your financial situation. Simply Wall St has no position in the stocks mentioned.
We aim to bring you long-term focused research analysis driven by fundamental data. Note that our analysis may not factor in the latest price-sensitive company announcements or qualitative material. Thank you for reading.

