
 Yahoo Movies
 Hubbell Incorporated's (NYSE:HUBB) Stock Has Seen Strong Momentum: Does That Call For Deeper Study Of Its Financial Prospects?
Hubbell's (NYSE:HUBB) stock is up by a considerable 16% over the past three months. As most would know, fundamentals are what usually guide market price movements over the long-term, so we decided to look at the company's key financial indicators today to determine if they have any role to play in the recent price movement. Particularly, we will be paying attention to Hubbell's ROE today.
Return on equity or ROE is an important factor to be considered by a shareholder because it tells them how effectively their capital is being reinvested. In short, ROE shows the profit each dollar generates with respect to its shareholder investments.
View our latest analysis for Hubbell
How Is ROE Calculated?
The formula for return on equity is:
Return on Equity = Net Profit (from continuing operations) ÷ Shareholders' Equity
So, based on the above formula, the ROE for Hubbell is:
20% = US$448m ÷ US$2.3b (Based on the trailing twelve months to June 2022).
The 'return' is the profit over the last twelve months. So, this means that for every $1 of its shareholder's investments, the company generates a profit of $0.20.
What Is The Relationship Between ROE And Earnings Growth?
We have already established that ROE serves as an efficient profit-generating gauge for a company's future earnings. Based on how much of its profits the company chooses to reinvest or "retain", we are then able to evaluate a company's future ability to generate profits. Generally speaking, other things being equal, firms with a high return on equity and profit retention, have a higher growth rate than firms that don’t share these attributes.
Hubbell's Earnings Growth And 20% ROE
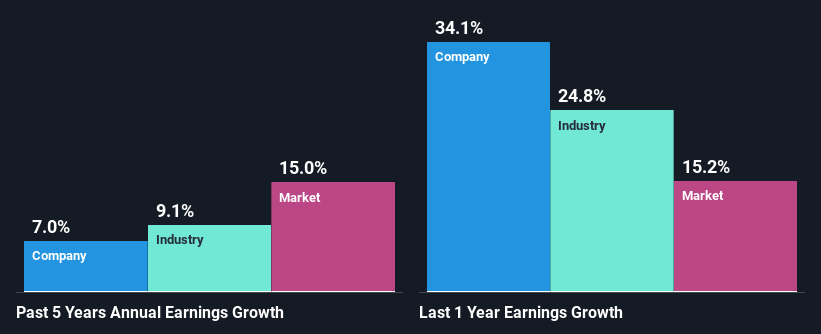
To start with, Hubbell's ROE looks acceptable. On comparing with the average industry ROE of 12% the company's ROE looks pretty remarkable. Probably as a result of this, Hubbell was able to see a decent growth of 7.0% over the last five years.
We then compared Hubbell's net income growth with the industry and found that the company's growth figure is lower than the average industry growth rate of 9.1% in the same period, which is a bit concerning.
The basis for attaching value to a company is, to a great extent, tied to its earnings growth. The investor should try to establish if the expected growth or decline in earnings, whichever the case may be, is priced in. This then helps them determine if the stock is placed for a bright or bleak future. What is HUBB worth today? The intrinsic value infographic in our free research report helps visualize whether HUBB is currently mispriced by the market.
Is Hubbell Using Its Retained Earnings Effectively?
Hubbell has a significant three-year median payout ratio of 53%, meaning that it is left with only 47% to reinvest into its business. This implies that the company has been able to achieve decent earnings growth despite returning most of its profits to shareholders.
Additionally, Hubbell has paid dividends over a period of at least ten years which means that the company is pretty serious about sharing its profits with shareholders. Existing analyst estimates suggest that the company's future payout ratio is expected to drop to 38% over the next three years. However, the company's ROE is not expected to change by much despite the lower expected payout ratio.
Conclusion
In total, it does look like Hubbell has some positive aspects to its business. Its earnings have grown respectably as we saw earlier, which was likely due to the company reinvesting its earnings at a pretty high rate of return. However, given the high ROE, we do think that the company is reinvesting a small portion of its profits. This could likely be preventing the company from growing to its full extent. Having said that, looking at the current analyst estimates, we found that the company's earnings are expected to gain momentum. To know more about the latest analysts predictions for the company, check out this visualization of analyst forecasts for the company.
Have feedback on this article? Concerned about the content? Get in touch with us directly. Alternatively, email editorial-team (at) simplywallst.com.
This article by Simply Wall St is general in nature. We provide commentary based on historical data and analyst forecasts only using an unbiased methodology and our articles are not intended to be financial advice. It does not constitute a recommendation to buy or sell any stock, and does not take account of your objectives, or your financial situation. We aim to bring you long-term focused analysis driven by fundamental data. Note that our analysis may not factor in the latest price-sensitive company announcements or qualitative material. Simply Wall St has no position in any stocks mentioned.
Join A Paid User Research Session
You’ll receive a US$30 Amazon Gift card for 1 hour of your time while helping us build better investing tools for the individual investors like yourself. Sign up here

